- Email: genny.hoffman ( at ) gmail.com
Lumenograph
Data Visualization and Light Sculpture, 2010
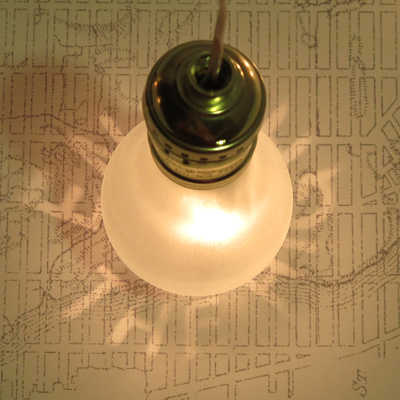
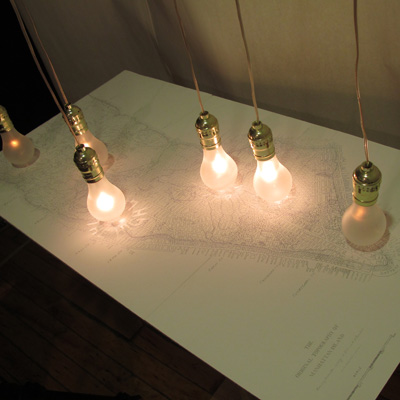
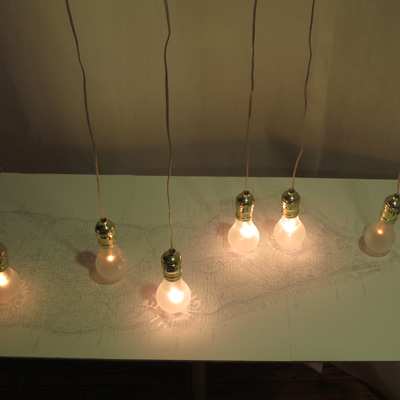
New York City, especially the island of Manhattan, is one of the most densely populated places on earth. At night, it is also one of the most illuminated – whether for entertainment, commerce or public safety. Lumenograph is a physical data visualization that compares the amount of light in six specific locations around Manhattan throughout the night.
We selected locations that were relevant to our daily lives, both for personal significance as well as ease of data collection over a 24 hour period. In addition, we also selected a few locations based on what we thought they might yield in data, namely Times Square, one of the best-illuminated places at night in the world. To collect this data we used a Data Logging shield with an IC to Frequency microchip, which converts the intensity of light over the sensor into a frequency value that was recorded onto an SD card.
Lumenograph was made with Emily Webster and Ju Yun Song.